Role
UX/Designer, Product Strategists
UX/Designer, Product Strategists
Latent AI
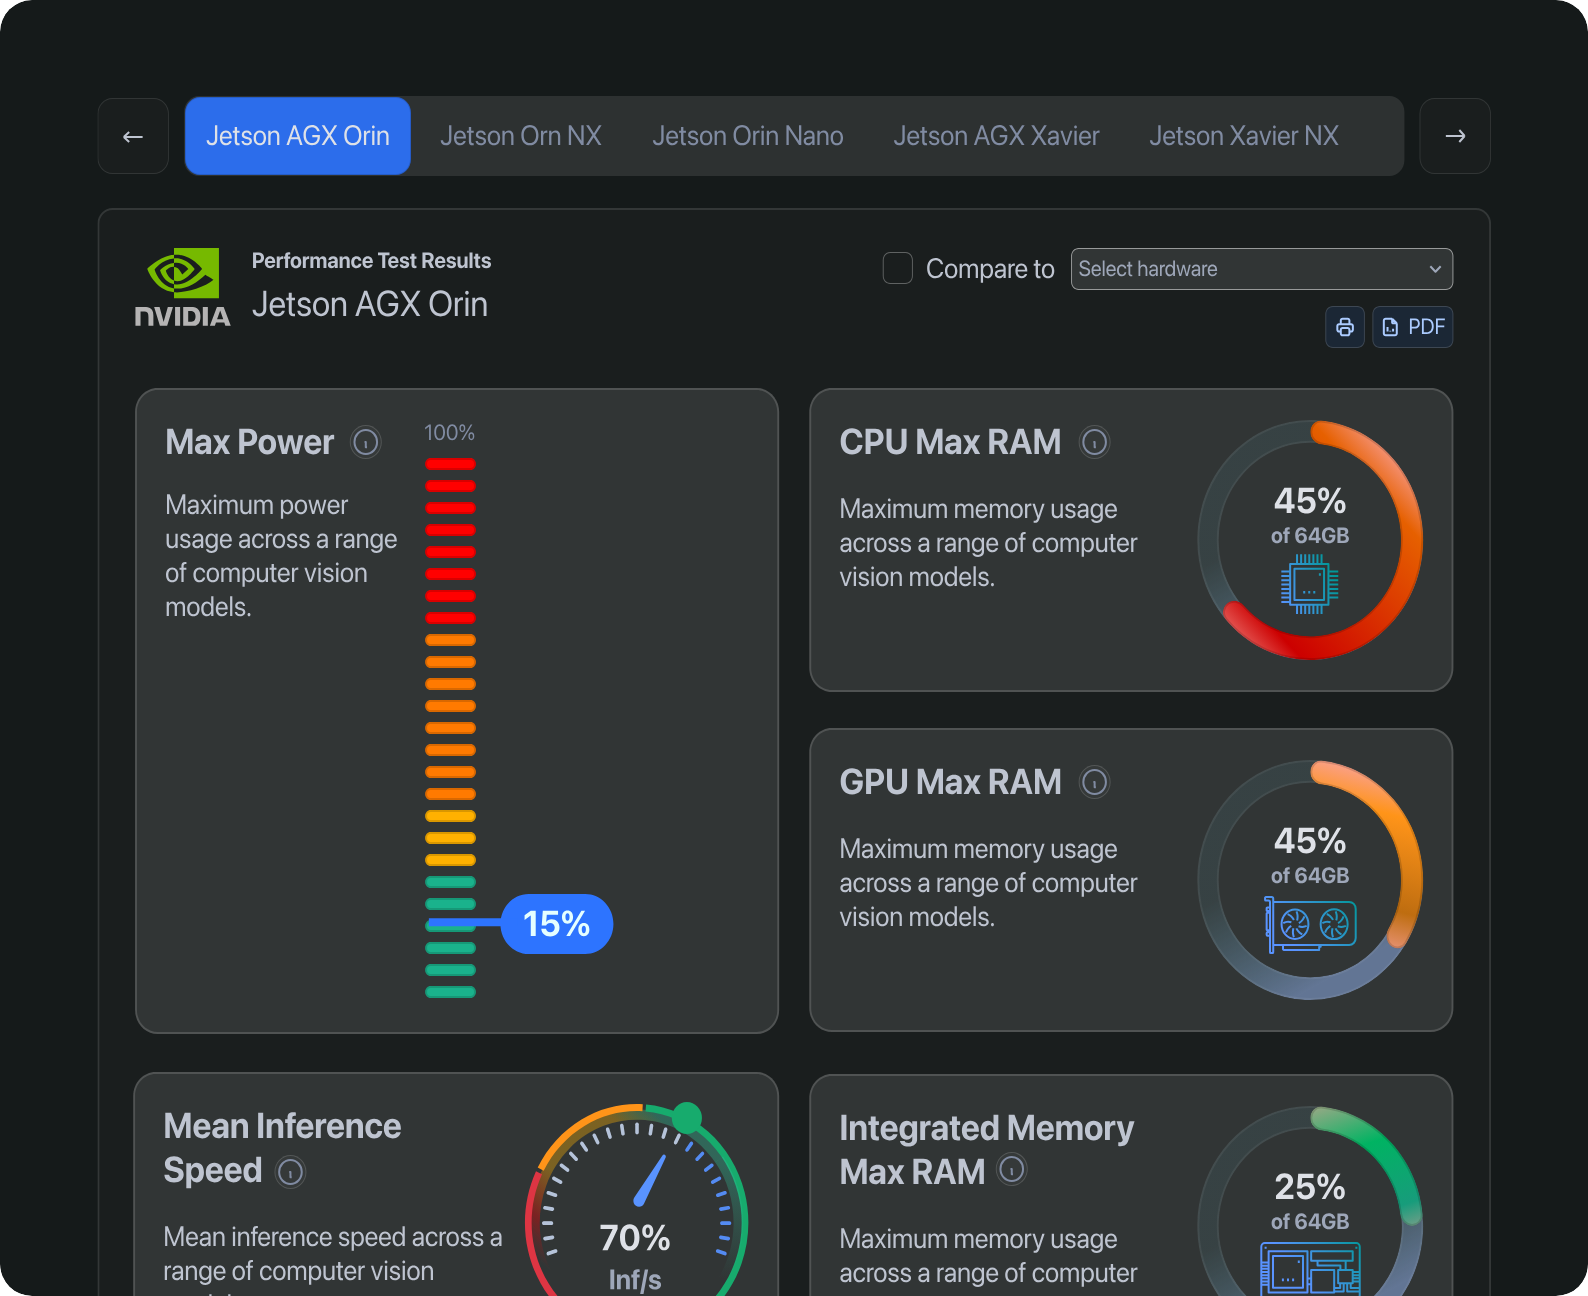
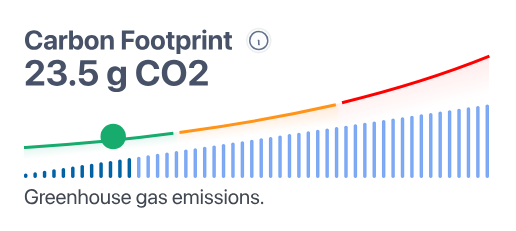
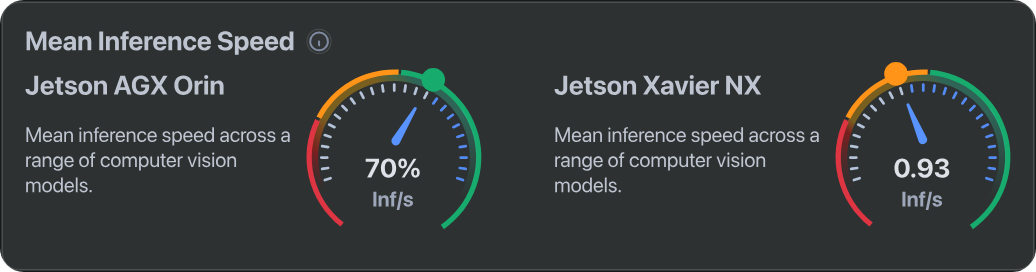
This is a tool for hardware manufacturers to assess how their hardware performs with various machine learning models. The data produced is in the form of beautiful and expressive charts. The charts communicate complex ideas in a concise visual language.
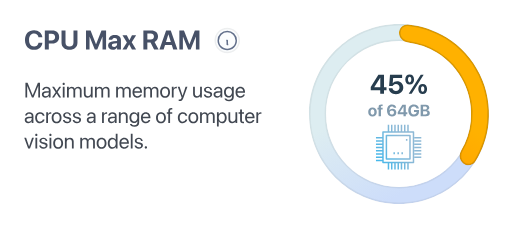
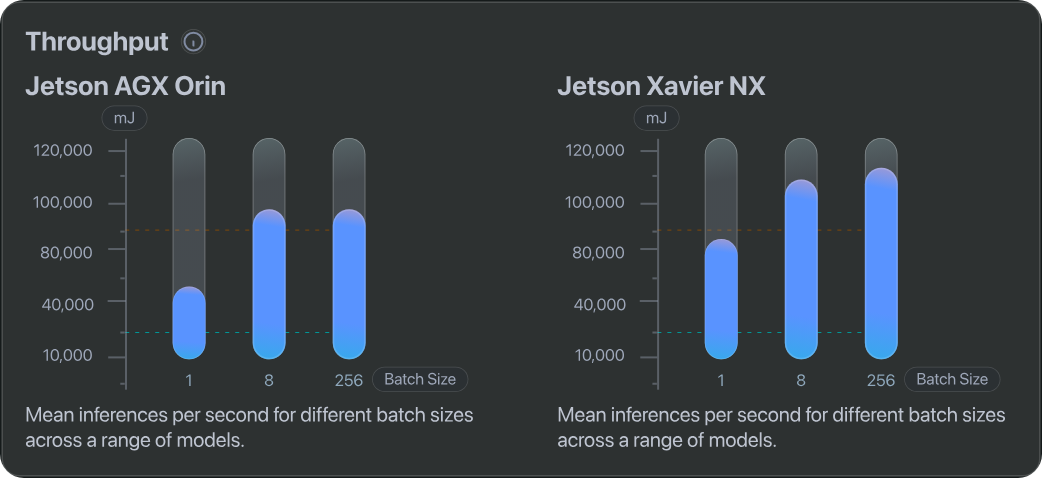
To facility easy buying decisions, I added a comparitive feature that allows customers of OEMs to compare hardware determine which ones perform better and suit their needs.
The example to the left highlights key differences between products in the same hardware line i.e the NVIDIA Jetson devices.

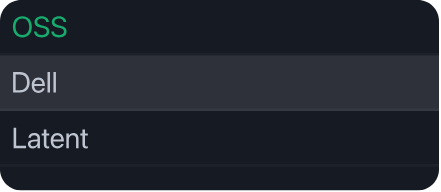

I designed the unique workflow of enabling data switching between multiple brands. This workflow makes it possible for a user to understand the full gamet of hardware possibilties in order to select the correct hardware.

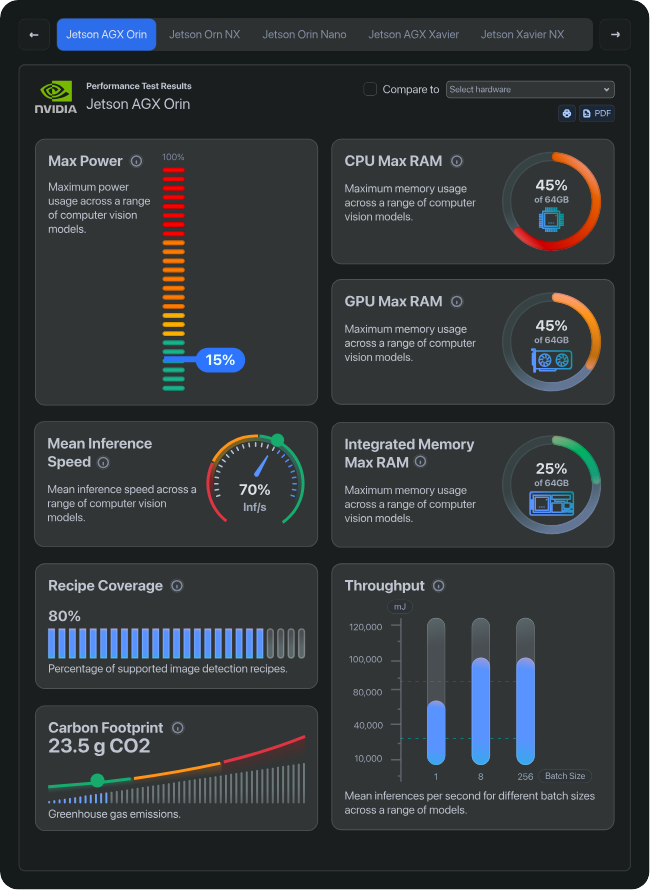
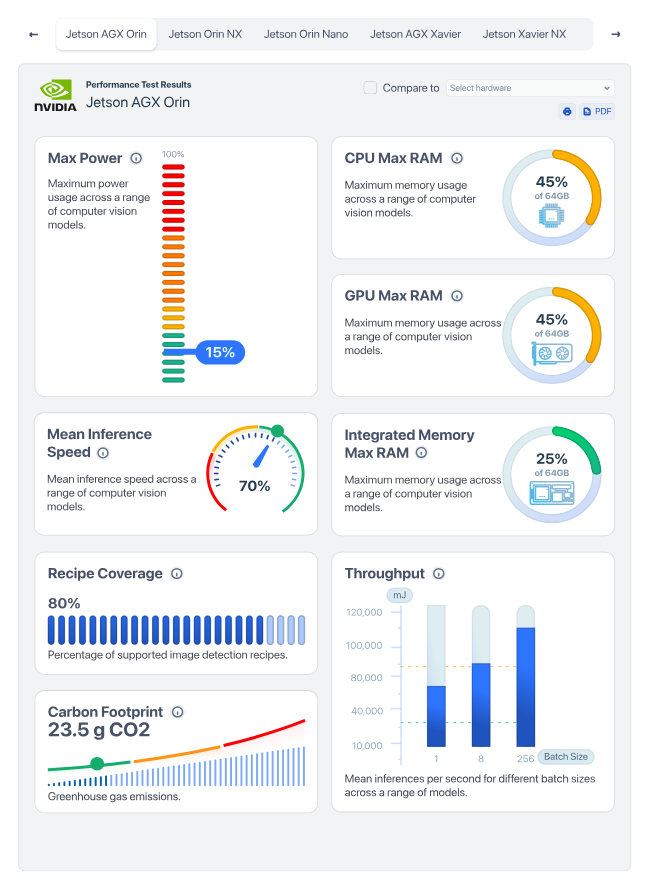
One of the key business objectives of this project is to makine the work of selling hardware to customers easy. I therefore set about creating an attractive dashboard system that can easily be shared via url link or printed out to be used as a talking point. The OEMs we worked with loved this feature a lot and helped us sell the product to them.